We’ve all sensed the change, but it’s fascinating to study the numbers. Just released by FX Network, an annual count of television series produced by/for/with:
- Broadcast television networks (such as ABC or CW)
- Pay cable networks (such as HBO or Showtime)
- Basic cable networks (such as USA or Nickelodeon)
- Online Services (such as Amazon or Netflix)
In 2002, the broadcast networks produced 135 of 182 series; pay cable accounted for 17, and basic cable networks produced 30.
In 2009, there were just a few online series. Today, there are nearly 100.
Today–just seven years later–basic cable networks produce more original series than broadcast networks. In part, that’s because there are so many basic cable networks, and in part, because so many of them are now producing original material. Of 455 original series on U.S. television, online services are now responsible for about 1 in 5 of them.
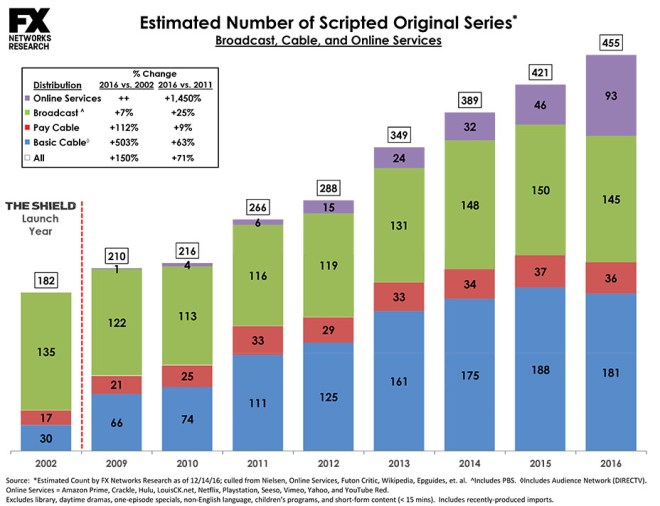 But check out the trend: in 2013, there were 24 original series available online. In 2015, that number had basically doubled to 46, and it doubled again a year later. If the trend continues, 2017 will be the year when basic cable and online services produce an equal number of original series, and 2018 will be year when online services produce more original series than any other U.S. “networks” (we lack an English-language term that describes both online services and television networks).
Bear in mind:
- These numbers count only “scripted original series” and do not include daytime dramas, specials, children’s programs, short-form content (less than 15 minutes), or programs not produced in English. If we add children’s programs–Nickelodeon, Disney, etc.–the numbers change, probably in favor of basic cable now, and online services in a year or two (all are stepping up).
- These numbers do not count non-U.S., and we’re certainly seeing this shift in other parts of the world. A global chart would be wonderful, but then, so would U.S. access to programs shown throughout the world (the arrow typically points from the U.S. to others).
- For now, the basic cable networks seem to be holding steady at about 175-185 series, and the same is true for broadcast networks at about 145-150. Ditto for the pay cable services at about 35 original scripted series per year, but look at those online services grow!
Can’t help but wonder how these supply numbers compare with demand. If we were to chart hours viewed per week, I wonder whether the horses would finish in this order: basic cable, broadcast, online services, pay cable. I’ll try to find an answer. Meanwhile, readers, if you can help with that side of the equation, please do.
 The old ratio was 3 by 4: a reliable compression of reality, the extra window in every household that looked out at the world. It offered a limited view, controlled by powerful producers and directors, versatile performers, intense journalists who learned the trade by explaining why and how the Germans were bombing the guts out of London during World War II. Very few people were allowed to put anything into that window: NBC, CBS, ABC and a few local television companies controlled every minute of the broadcast day. It was radio with pictures, a new medium that learned its way through visual storytelling when the only colors were shades of grey.

 Where does this lead? And how do we even begin to think about the future when so much television viewing is now on-demand and so much audio listening is via Pandora, podcasts,
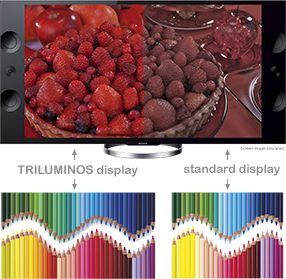 Anyway… I woke up this morning to an announcement from Sony… with all sorts of enticing promises: improved detail, improved color rendition, better audio, screen mirroring so what’s on your tablet can be viewed on your new TV (albeit it in lesser detail, a service currently available to Apple users).


